AI-Sorted Collections Delivered 145% Higher Conversion Rates in March 2026
Every product collection on your Shopify store is a silent sales pitch. The order your products appear in shapes what customers click, what they add to cart, and whether they buy — or bounce.
Most merchants don’t think much about collection sorting. They leave it on Shopify’s default settings — alphabetical, best-selling, newest first — and hope for the best. But “hope” isn’t a merchandising strategy. In March 2026, Dynasort tracked over 6.3 million collection sessions across thousands of Shopify stores, and the data tells a clear story: AI-optimized product sorting dramatically outperforms the default. Across every key metric — conversion rate, cart rate, exit rate, and bounce rate — Dynasort-sorted collections delivered meaningfully better results. Let’s break down exactly what that looks like.
Key Metrics: Dynasort vs. Shopify Default Sorting
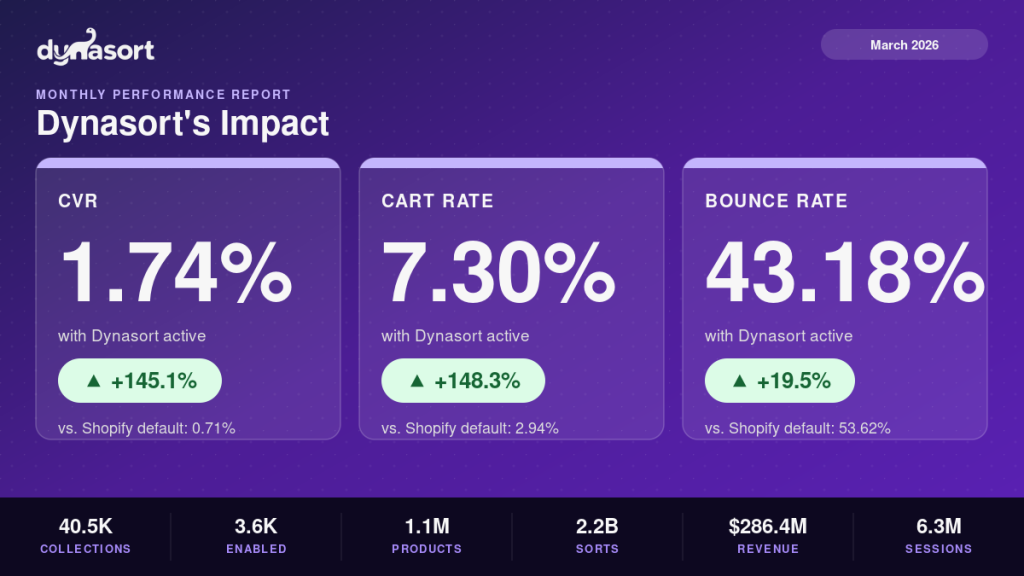
Here’s how collections using Dynasort’s AI sorting compared to collections using Shopify’s standard sorting options in March 2026.
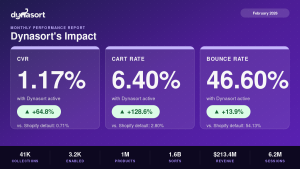
Conversion Rate: 1.74% vs. 0.71% (↑ 145.07%)
This is the headline number, and it’s the one that matters most. Conversion rate measures the percentage of collection visitors who completed a purchase. Dynasort collections converted at 1.74% compared to just 0.71% for default-sorted collections — a 145% improvement.
To put that in perspective: if your store gets 10,000 collection visits per month and your average order value is $75, moving from 0.71% to 1.74% CVR means going from roughly $5,325 in revenue to approximately $13,050. That’s an additional $7,725 per month — from the same traffic you’re already paying for. No new ad spend. No redesign. Just smarter product ordering.
Cart Rate: 7.3% vs. 2.94% (↑ 148.3%)
Cart rate measures the percentage of collection visitors who added at least one product to their cart. Dynasort collections hit 7.3% compared to 2.94% for default sorting — a 148% lift.
This metric reveals something important about intent. When products are sorted in an order that matches what shoppers are actually looking for, they engage. They don’t just browse — they take action. A higher cart rate means your collections are doing their job: surfacing the right products to the right shoppers at the right time.
Exit Rate: 57.24% vs. 64.4% (↓ 11.12% improvement)
Exit rate tracks how often a collection page is the last page a visitor sees before leaving your store entirely. Dynasort collections had an exit rate of 57.24% compared to 64.4% for default-sorted collections — an 11.12% improvement.
A lower exit rate means more shoppers are continuing to browse your store after viewing a collection. They’re clicking into product pages, exploring other categories, or heading to checkout. Poorly sorted collections, on the other hand, act like dead ends. When customers don’t see anything compelling near the top, they leave.
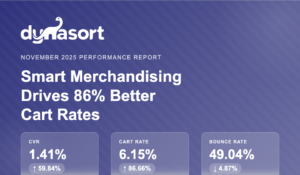
Bounce Rate: 43.18% vs. 53.62% (↓ 19.47% improvement)
Bounce rate measures visitors who land on a collection page and leave without interacting at all — no clicks, no scrolls, nothing. Dynasort collections reduced bounce rate to 43.18% versus 53.62% for Shopify defaults, a 19.47% improvement.
This is your first-impression metric. Nearly 1 in 5 additional visitors stayed and engaged when collections were sorted by Dynasort’s AI instead of Shopify’s static rules. For merchants spending money on paid traffic that lands on collection pages, this improvement alone can meaningfully change your ROAS.
Platform Scale: March 2026 by the Numbers
These results aren’t pulled from a handful of test stores. Here’s the scale Dynasort operated at in March:
- 40,490 collections tracked across the platform
- 3,556 collections actively sorted by Dynasort’s AI
- 1,069,782 products managed across all connected stores
- 2.23 billion collection sorts executed — that’s Dynasort’s algorithm continuously reordering products based on real-time performance signals
- $286.4 million in catalog revenue managed across all Dynasort-connected stores
- 6.32 million total collection sessions measured
This is production-scale machine learning applied to a problem most merchants solve with gut instinct or ignore entirely. Every sort decision is informed by actual shopping behavior — clicks, cart adds, purchases, and more — not static rules that go stale the day you set them.
What This Means for Merchants
If you’re running a Shopify store, here are the practical takeaways from this data:
Your collection sort order is a conversion lever. It’s not a cosmetic detail. The difference between a well-sorted and poorly-sorted collection is, based on March’s data, a 145% gap in conversion rate. Few optimizations on your store can deliver that kind of impact with zero ongoing effort.
Static sorting rules decay. “Best-selling” sorting sounds logical, but it creates feedback loops — top sellers stay on top, and new or seasonal products get buried. Dynasort’s AI continuously re-evaluates and adapts, which is why metrics like cart rate and bounce rate also improve, not just conversions.
You don’t need more traffic; you need more from your traffic. Every percentage point of bounce rate reduced and every additional cart add represents revenue you’re currently leaving on the table. With acquisition costs continuing to climb across Meta, Google, and TikTok, squeezing more value from your existing sessions is the highest-leverage move you can make.
Start Sorting Smarter
March 2026’s data reinforces what we’ve seen month after month: AI-optimized product sorting consistently and significantly outperforms Shopify’s default options. Higher conversion rates. More cart adds. Fewer bounces. More engaged shoppers.
Dynasort works in the background — no manual merchandising, no rules to configure, no ongoing maintenance. Install it, enable it on your collections, and let the algorithm do what static sorting can’t.
Try Dynasort free on the Shopify App Store →
Your products deserve to be seen in the right order. Your revenue depends on it.