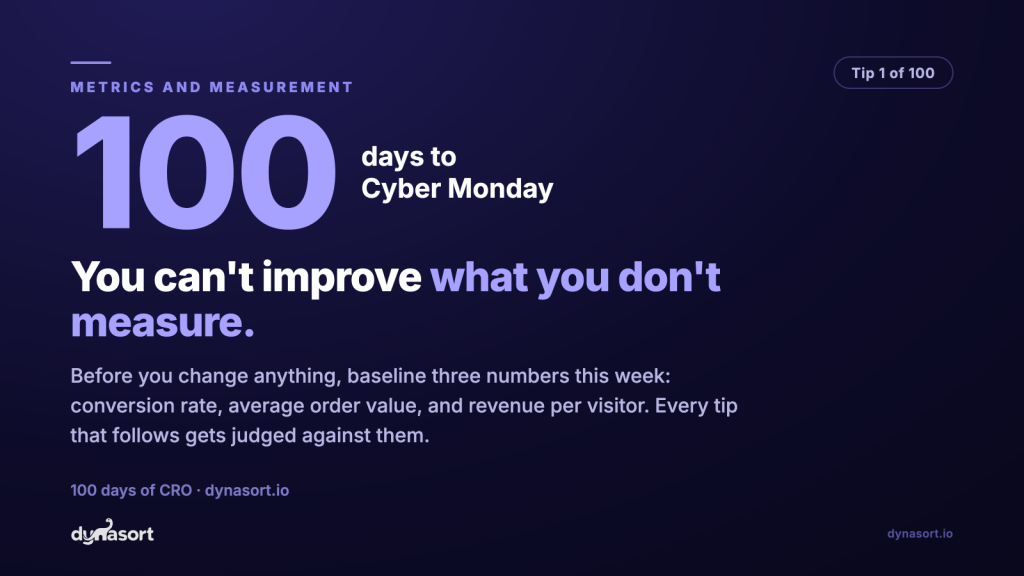
Conversion rate, average order value, and revenue per visitor: baseline these three Shopify metrics this week, before you change a single thing on your store. That is the entire tip. It is also the one most stores skip, which is why most CRO effort is indistinguishable from luck.
Here is the uncomfortable truth about conversion advice, including the 99 tips that follow this one: if you have no baseline, you cannot tell whether any change worked. You will ship a new hero image the same week an influencer mentions you, watch sales tick up, and credit the hero image. The store learns nothing. You just feel productive.
The three numbers
Conversion rate (CVR) is the percentage of sessions that end in a purchase. Average order value (AOV) is what a purchase is worth. Multiply them and you get the number we would keep if we could only keep one: revenue per visitor (RPV), what a single session is actually worth to your business.
Your baseline scorecard
Example numbers. Yours go on a sticky note, in a spreadsheet, anywhere you will see them again in two weeks.
RPV is the honest one. A popup that juices conversion 10% while shrinking orders 15% looks like a win on CVR and a loss on RPV. RPV catches the trick.
Are these the only numbers a merchant should care about? Of course not. Your P&L runs on margin, acquisition cost, repeat rate, returns, lifetime value. But those are moved by ads, pricing, and retention. These three are the scoreboard for the store itself: they are what moves when your website gets better at its one job, turning a visitor into an order. That is the job the next 99 tips attack, so this is the instrument panel we will fly by. Supporting gauges like add-to-cart rate and funnel step-offs join the panel in later tips.
Where to get them
All three live in your Shopify admin under Analytics. Set the date range to the last 30 days, note conversion rate and average order value from the dashboard, and divide total sales by total sessions for revenue per visitor. Ten minutes, no apps, no spreadsheet gymnastics required.
Date the numbers when you write them down. A baseline without a date is trivia. And use 30 days, not 7: one weekend sale or one slow Tuesday will lie to you in a weekly window.
A word about benchmarks
The first thing everyone does with a fresh baseline is Google whether it is “good.” Resist. Published averages like Littledata’s conversion benchmarks are fine for orientation, but a $30 impulse-buy store and a $900 furniture store should never be graded on the same curve. Traffic mix alone can double or halve your conversion rate without you touching anything.
The only benchmark that matters for the next 100 days is your store, 30 days ago. Beat that, repeatedly, and Cyber Monday takes care of itself: every point of improvement you bank now gets multiplied by the biggest traffic of your year.
That is the whole game, and it starts with three numbers on a sticky note. Go write them down.