Dynasort’s AI Sorting Doubled Conversion Rates in August 2026 — Here’s the Breakdown
Every Shopify store owner knows the feeling: you’ve spent money driving traffic, your products are solid, your images look great — but your collection pages just aren’t converting the way they should. The problem often isn’t what you’re selling. It’s the order customers see it in.
At Dynasort, we track exactly how our AI-powered collection sorting performs against Shopify’s default sorting — across thousands of real stores, millions of products, and billions of sort executions. August 2026 was our strongest month of data yet, and the results make a clear case: the order of your products matters enormously, and getting it right can double your conversions. Let’s dig into the numbers.
Key Metrics: How Dynasort Collections Performed vs. Shopify Default
We measure four core metrics that together paint a complete picture of collection page performance. Here’s how Dynasort-sorted collections compared to Shopify’s default sorting in August.
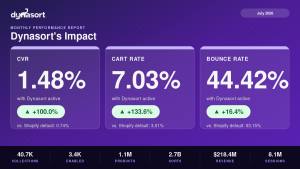
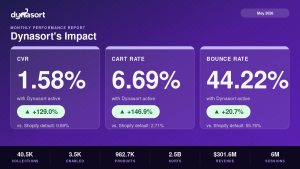
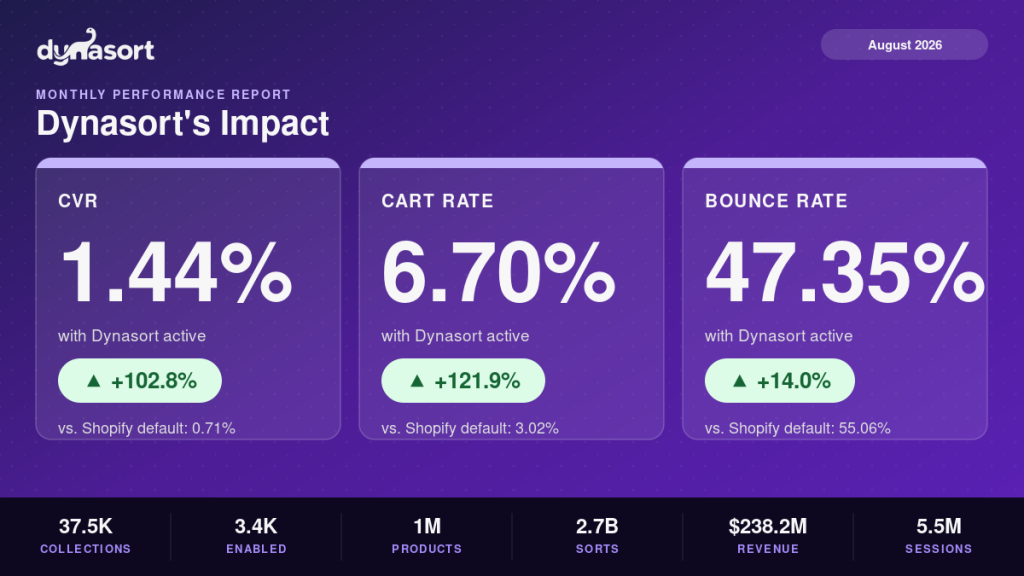
Conversion Rate (CVR): 1.44% vs. 0.71% — a 102.82% improvement
This is the metric that matters most to your bottom line. Conversion rate measures the percentage of collection page visitors who ultimately complete a purchase. Dynasort collections converted at more than double the rate of default-sorted collections.
To put that in practical terms: if your store gets 10,000 collection page visits per month and your average order value is $75, the difference between a 0.71% and 1.44% CVR is roughly $548 in additional monthly revenue — from the exact same traffic. No extra ad spend. No new products. Just a smarter product order.
Cart Rate: 6.7% vs. 3.02% — a 121.85% improvement
Cart rate measures how often visitors add a product to their cart from a collection page. This is the earliest and most reliable signal that a collection page is doing its job — surfacing the right products to the right shoppers at the right time.
Dynasort collections achieved a 121.85% higher cart rate than default sorting. That’s more than double the add-to-cart activity, which means Dynasort isn’t just nudging behavior slightly — it’s fundamentally changing how effectively your collection pages engage shoppers.
Exit Rate: 60.71% vs. 65.1% — a 6.74% improvement
Exit rate tracks the percentage of visitors who leave your site entirely from a collection page. A high exit rate means your collection page is a dead end rather than a gateway deeper into your store.
Dynasort reduced exit rates by 6.74%. While this may sound modest compared to the conversion and cart rate improvements, consider the scale: across over 5.5 million collection sessions in August alone, that improvement represents hundreds of thousands of additional visitors who stayed on-site, browsed further, and gave your store another chance to earn their business.
Bounce Rate: 47.35% vs. 55.06% — a 14% improvement
Bounce rate measures single-page sessions — visitors who land on a collection page and leave without interacting at all. It’s a harsh indicator of first-impression failure.
Dynasort brought bounce rates down by 14%, from 55.06% to 47.35%. That means more shoppers are finding something worth clicking on within the first few seconds. When your highest-potential products lead the page instead of being buried on row five, visitors stick around.
Platform Scale: Dynasort by the Numbers
August’s data isn’t drawn from a handful of test stores. These results reflect the performance of a mature, large-scale platform:
- 37,526 collections tracked across the Dynasort platform
- 3,441 collections actively sorted by Dynasort’s AI
- 1,023,530 products managed — over one million individual SKUs optimized
- 2.65 billion sort executions performed throughout the month
- $238.15 million in catalog revenue managed across Dynasort-enabled stores
- 5.52 million total collection sessions measured
These aren’t projections or lab results. This is production data from real Shopify stores selling real products to real customers. The scale of data behind these benchmarks is what gives us — and our merchants — confidence that the improvements are meaningful and repeatable.
What This Means for Merchants
If you’re a Shopify store owner, here are the practical takeaways from August’s data:
Your default collection sort is likely costing you sales. Shopify’s built-in sorting options — bestselling, newest, price-based, alphabetical — are static and one-dimensional. They don’t account for real-time customer behavior, inventory changes, margin targets, or seasonal trends. August’s data shows that stores relying on these defaults are converting at roughly half the rate of stores using AI-driven sorting.
Small changes at the collection level compound fast. Most conversion optimization advice focuses on checkout flows, product pages, or ad targeting. Collection pages are often overlooked — but they’re frequently the highest-traffic pages on your store and the primary way customers browse your catalog. Improving performance here has an outsized impact.
You don’t need more traffic — you need smarter merchandising. The stores in our August data didn’t get more visitors to see these improvements. They got better results from the visitors they already had. In a landscape where acquisition costs keep climbing, that kind of efficiency gain is the highest-leverage move you can make.
Ready to See What Smarter Sorting Can Do for Your Store?
August’s results reinforce what we’ve seen month after month: AI-sorted collections outperform default sorting across every metric that matters — more add-to-carts, higher conversion rates, lower bounce rates, and fewer exits.
The best part? You don’t have to take our word for it. Dynasort offers a free trial so you can see the impact on your own store, with your own products and your own customers.
Try Dynasort free on the Shopify App Store →
Your products deserve to be seen in the right order. Let the data do the selling.