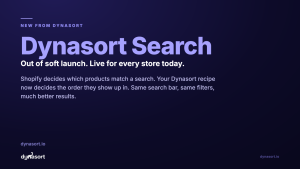
On Monday we launched Dynasort Search and made a claim: default search ordering treats your highest-intent shoppers worse than any other page on your store. A claim like that deserves data, so today we are opening the books.
Two datasets. First, the fleet: every storefront search that flowed through stores on the Dynasort platform over the last 30 days, bots excluded. Second, a deep dive into one high-traffic apparel and jewelry store’s full year of search tracking. Everything is aggregated or anonymized, and as always we will tell you exactly how far each number can honestly be stretched.
The fleet, in two numbers
Storefront search, fleet-wide
All stores on the Dynasort platform, last 30 days, human traffic only. Bots excluded.
Fleet numbers. Zero-result rates vary widely from store to store depending on catalog breadth.
Just over 1.34 million searches in a month is a lot of shoppers typing exactly what they want into a box. Search users are widely known to be the highest-intent visitors on a store, which is what makes both of those tiles matter: the surface is busy, and one in every 22 of those high-intent moments ends in a blank page.
Where clicks actually land: one store, one year
Fleet totals tell you how big the surface is. To see how shoppers behave on it, we went deep on a single high-traffic apparel and jewelry store: 365 days of tracking, 188,323 clicks on search results. To be clear up front, this is one store we studied closely, not a fleet average.
Click position distribution
One high-traffic store, 365 days, 188,323 search result clicks. Share of clicks by result position.
Average click position: 4.51. The positions 7 to 12 bucket collected as many clicks as position 1 did: 28.5 percent each.
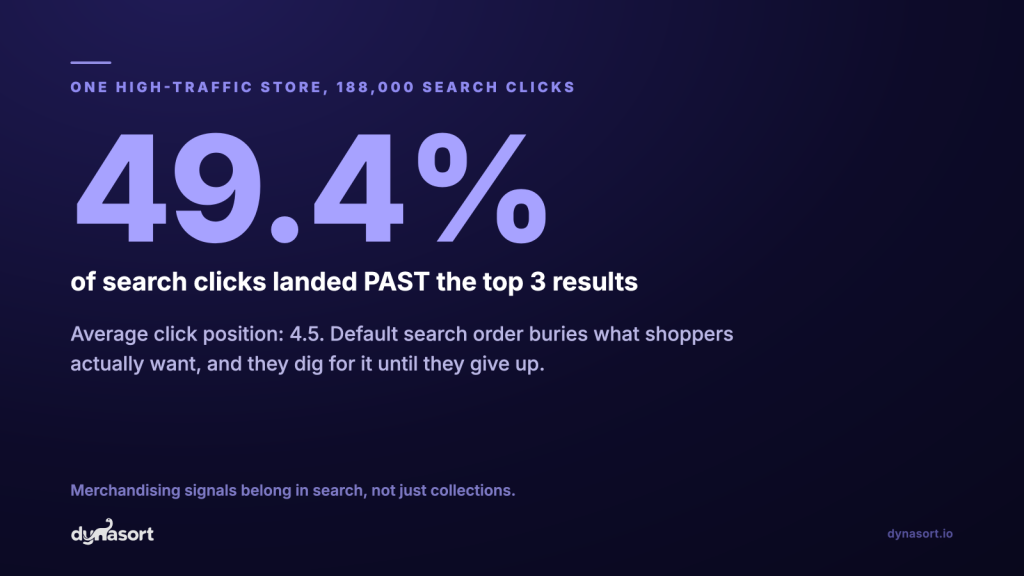
Only 28.5 percent of clicks landed on the first result. Nearly half of all clicks, 49.4 percent, landed past the top three, and the average click sat at position 4.51. The detail that surprised us most: positions 7 through 12, the bottom half of a typical first screen, collected exactly as many clicks as position 1.
That says two things at once. Shoppers on this store scan well past the top, so a good product at position 9 is not lost. But position still carries enormous weight per slot: one slot got 28.5 percent of clicks, and it took six slots further down to match it. Whatever sits at the top gets a structural advantage, and default text relevance hands that advantage out with no idea what is in stock, what is selling, or what just launched. That is the whole argument for putting merchandising signals in charge of the order, and it is why we built Dynasort Search.
Zero-result searches are shoppers telling you what they wanted
The same store gave us a year of dead ends to study: 602,891 searches, of which 37,183 returned nothing at all. That is a 6.2 percent zero-result rate, a bit above the 4.5 percent fleet figure for the last 30 days.
A zero-result search is the most honest feedback a store ever gets. Nobody types into a search box by accident. This store’s zero-result queries clustered into three buckets: catalog gaps, synonym gaps, and typos. The single largest source of unmet demand was a product category the store simply did not carry, followed by obvious typo variants of things it did.
Dynasort tracks every storefront search on a connected store, including the dead ends, so this list is not a research exercise. It is sitting in your search report: the exact words shoppers used, ranked by how often they hit nothing. Some entries are a merchandising fix, some are a synonym you can add in five minutes, and some are a product line your shoppers keep asking for by name.
How to read these numbers honestly
This is a data post in a series whose whole point is honest math, so here are the limits.
- The click position data comes from one store. It is a large, clean, year-long sample, but a store with a different catalog, theme, or grid layout will scan differently. Treat the shape as a well-documented example, not a law.
- Zero-result rates vary widely by catalog breadth. A store with 40 products will see far more dead ends than a store with 40,000, and neither number is a report card.
- Re-ranking does not fix zero-result searches. If nothing matches, there is nothing to reorder. The fix for dead ends is usually catalog or synonym work. Re-ranking helps the other 95 percent of searches, the ones that do match and then come back in an order chosen by text relevance alone.
- None of this is a causal claim about conversion. Search users convert at multiples of browsing shoppers across the industry because high-intent people search, not because a search box works magic. What the data supports is narrower and still valuable: search is a busy, high-intent surface, position on it carries real weight, and the default order is decided by a signal that knows nothing about your business.
What to do with it
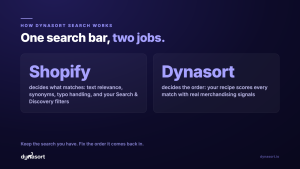
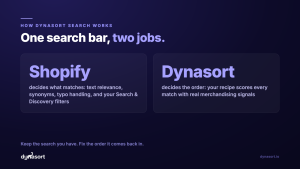
If half the clicks on a busy store land past the top three, the order of the whole first page is merchandising real estate, not just slot one. Dynasort Search puts your recipe in charge of that order: recent sales, inventory depth, newness, margin, or any custom signal you build, on both the results page and the predictive dropdown. Shopify still decides what matches. Your business decides what comes first. Monday’s launch announcement has the full picture, and tomorrow we close the week with a practical guide to search recipes and result cards.
Install Dynasort free for 30 days or read the search docs. Already a Dynasort merchant? Your search report is already collecting this data for your store, and a free setup session gets search live with you on a screen share.