Every merchant eventually asks the same question: what should my collections actually be sorted by? Best sellers? New arrivals? Stock levels? Margin?
We decided to stop answering from instinct. We read every sorting recipe running on Dynasort, more than 200 distinct ranking signals, 161 of them built by merchants themselves, and then watched more than 20 million shopper sessions flow through those collections over 60 days. Everything below is aggregated and anonymized. No store is named, no store is identifiable.
Some of what we found flatters us. Some of it does not. You are getting all of it.
First, the honest math
Collections that merchants sort with Dynasort convert at nearly twice the rate of collections left on autopilot. 1.20 percent versus 0.63 percent, measured across millions of sessions.
Great headline. Now watch what happens when the comparison gets fairer.
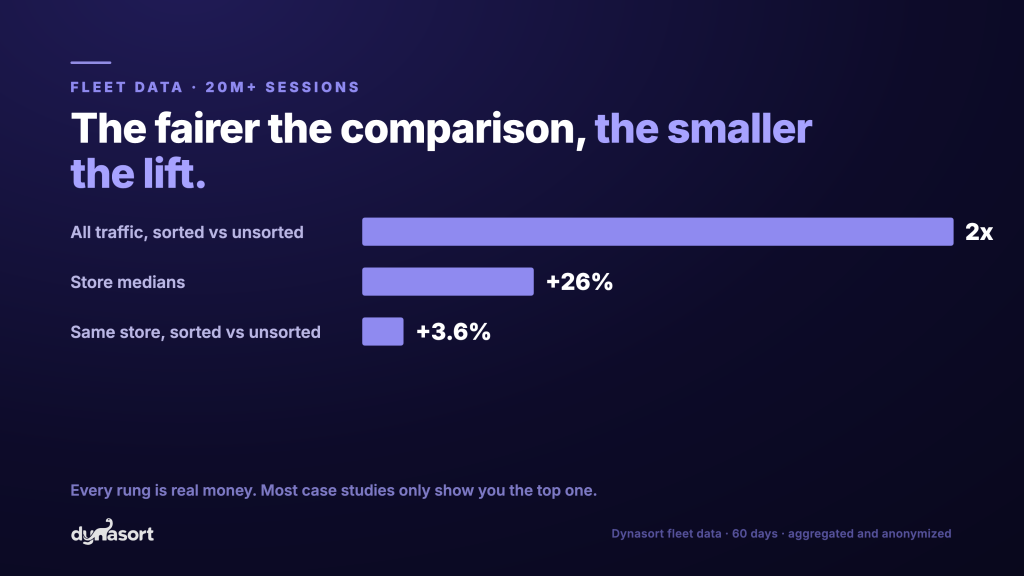
Compare store medians instead of raw traffic and the gap drops to about 25 percent. Compare sorted against unsorted collections inside the same store, the fairest cut we can make, and sorted collections win in 56 percent of stores with a median gain under 4 percent.
The honest math ladder
Same data, same 60 days. The lift shrinks every time the comparison gets fairer.
Every rung is real money. Most case studies only show you the top one.
Two times, then 25 percent, then 4 percent. The number shrinks every time the comparison gets more honest, because merchants sort the collections that already matter and the stores that bother sorting are the stores that bother with everything else too. Most merchandising case studies you will ever read stop at the first number. We think the whole ladder tells you more: the honest gain is smaller than the marketing gain, and it is still real, still repeatable, and still sitting there unclaimed on most stores.
What the fleet actually runs on
Ten built-in signals plus merchant-built custom attributes account for four out of five live recipe attachments: inventory quantity, 30-day sales, on-sale status, age of newest variant, 7-day sales, all-time sales, sold-out status, full size run, variants in stock, and days since published.
Everything else is a long tail. That tail is where the interesting stuff lives, in both directions.
What works
Conversion by signal family
Sessions touching collections whose live recipe includes the signal. Traffic-weighted conversion, 60 days, major families only.
Sorted-fleet average: 1.20 percent. Signals can share a recipe, so families overlap. Whale-store and median checks in the method note at the end.
Demoting sold-out products is the closest thing to free money in the data. Recipes that push sold-out products down, or hide them outright, show the lowest bounce rate of any major signal family: about a third of sessions bounce, against nearly half fleet-wide. Conversion runs roughly 55 percent above the sorted-fleet average. Nothing kills buying momentum like a wall of products nobody can buy, and the data says shoppers punish it every single day.
Freshness sells, measured the right way. Among widely used signals, age of newest variant posts the best median collection conversion in the fleet. Notice it is not “days since the product was created.” Ranking on how recently you added or refreshed variants rewards restocks and new colorways, not just new SKUs. Merchants using it are quietly outperforming the ones sorting by product creation date.
Sales windows of 7 and 30 days are the sweet spot. Recent enough to track demand, wide enough to be statistically calm.
The margin surprise. We expected to write that sorting by profit hurts conversion, that shoppers can somehow smell it. The data refused to cooperate. Stores that blend margin into their recipes convert above the sorted-fleet median. Sorting profit-aware does not automatically cost you sales, so if you have been treating margin as a guilty secret in your merchandising, stop.
What underperforms
Twitchy time windows. One-day and three-day windows underperform their 7-day and 30-day siblings in every signal family where both exist: sales, revenue, and cart adds. A day of data is small enough that the sort order reshuffles on noise, and a collection that reshuffles daily is a collection nobody recognizes on their second visit.
Raw view counts. Recipes ranking on product views sit below the fleet median at every window we offer. Views measure attention, not intent, and ranking by views is a feedback loop: whatever was on top yesterday collects views and stays on top tomorrow. Rank by carts and purchases instead; they measure what shoppers do, not what they scroll past. Fewer stores run these recipes, so treat this one as a strong pattern rather than a law.
The humbling one
We would love to tell you that hand-tuned recipes crush our seeded defaults. In stores running both, tuned recipes beat the defaults about half the time.
A coin flip.
That is not an argument against tuning. It is an argument against trusting anyone’s gut, including ours, and it is exactly why A/B testing is built into Dynasort. Our own biggest completed on-versus-off test so far: sorting on ran about 35 percent higher conversion across roughly 8,000 sessions, and it is still not statistically significant. Plenty of vendors would have shipped that as a case study headline. We are telling you it needs more traffic, because when we finally publish lift numbers, we want them to survive the ladder from the top of this post.
The merchants who build their own signals
161 of the ranking signals in the fleet are custom attributes merchants built themselves: restock dates, sell-through targets, seasonal flags, supplier priorities pushed in through the API.
Build it and they will sort
Share of defined ranking signals that are attached to a live storefront right now.
The built-in number is dragged down by starter recipes that never get attached, and the gap is still the point.
Here is the stat that made us sit up. Three out of four merchant-built attributes are live on a storefront right now. For built-in signals, dragged down by starter recipes that never get attached, it is under one in ten. When a merchant invests the ten minutes to define a signal only their business has, they use it, they keep it, and they sort real traffic with it. If you have a spreadsheet column somewhere that secretly runs your merchandising, that column wants to be a custom attribute.
The shelf nobody has found
And then there are the signals almost nobody has discovered: back-in-stock demand, most-clicked, location-level stock, search-behavior signals. Adoption is close to zero. That one is on us, not on you, and it is getting fixed. If you want to be the merchant who gets there before your competitors do, the shelf is open.
How we measured, so you can judge it
Sixty days of data. Conversion means the session viewed the collection and completed checkout in the same session. Collections whose recipe or status changed mid-window were excluded, A/B variant traffic was excluded, and where a single high-traffic store distorted a segment we checked medians and reran the numbers without it. Everything here is correlation across a fleet, not a controlled experiment, which is precisely why the product ships with a testing tool. Run your own experiment; your store outranks our averages.
Install Dynasort free for 30 days or read the docs to see every ranking signal, including the shelf nobody has found yet.